
streamlit_app.py that queries daily adjusted prices with
st.connection("snowflake"), upload it to a stage, and run CREATE STREAMLIT. The app below is under 100 lines, needs no extra packages, and
charts growth of $10,000, prices and drawdowns for any US stock or ETF.
Below are the full code, the SQL to deploy it, how to share it, and what it
costs to keep running, which depends on a runtime setting most tutorials
skip.
The app reads
security_vw and security_price_history_vw from Fruit
Stand’s Historical Stock Prices
listing, which
we publish. We deployed it on the container runtime on November 20, 2026,
with prices through November 19. It works with any
table of tickers, dates and adjusted closes.What the dashboard does
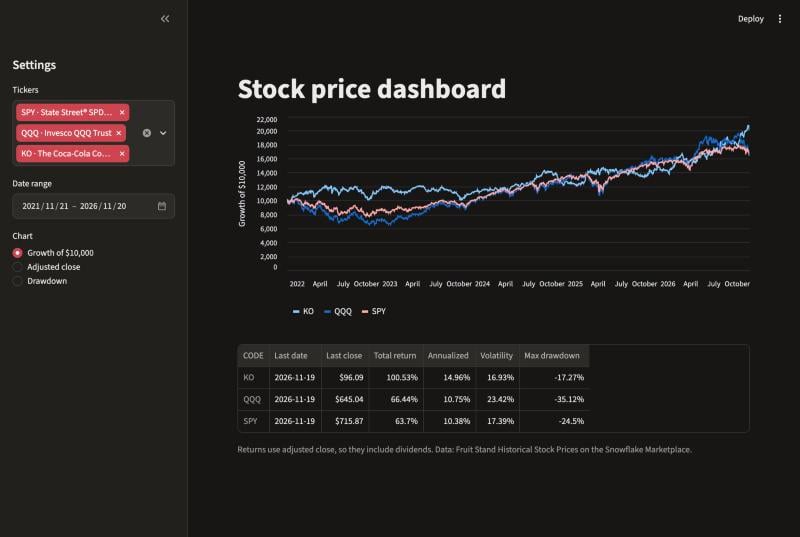
- Pick up to 10 tickers from every active US stock and ETF in the listing, 23,332 of them, searchable by ticker or name.
- Choose a date range, five years by default.
- Switch the chart between growth of $10,000, adjusted close and drawdown from the running peak.
- Read a summary table with the last close, total and annualized return, annualized volatility and maximum drawdown for each ticker.
adjusted_close, so returns include dividends and splits
don’t show up as crashes. For the five years to November 19, 2026, Coca-Cola
(KO) returned 100.5% with dividends, more than SPY’s 63.7%, with a maximum
drawdown of 17.3% against SPY’s 24.5%.
The app code
Save this asstreamlit_app.py. Change SOURCE to the database name you
chose when you got the listing:
How the code works
- Snowflake does the filtering. The price query asks for only the selected tickers and dates, and computes growth of $10,000 and drawdown with window functions. Snowflake’s own stock dashboard quickstart instead loads seven tickers’ whole history into pandas and filters there, which doesn’t scale to thousands of tickers.
- Parameters use
?and a list.conn.querybinds parameters server-side, so named placeholders like%(start)swith a dictionary fail with “Binding parameters must be a list”. Aninlist doesn’t bind either; joining the tickers into one string and usingsplit()witharray_containsdoes, and keeps the query safe from injection. - Results are cached.
ttl="1h"on the price query and"12h"on the ticker list mean a repeat selection doesn’t hit the warehouse. On our X-Small warehouse, a three-ticker, five-year query took 3 to 4 seconds uncached. - Prices are adjusted. Chart a raw close and every stock split looks
like a crash.
adjusted_closefixes that and adds back dividends; see Adjusted Close vs. Close. - No extra packages. The app uses only Streamlit’s built-in charts and
pandas, which ship with the runtime, so there’s no
requirements.txtand no external access integration to set up.
Deploy it with SQL
You can paste the code into a new app in Snowsight (Projects » Streamlit » + Streamlit App), or deploy it with SQL. Upload the file withPUT from a client such as the Snowflake CLI or SnowSQL, using your own
file path:
CREATE STREAMLIT until
you add a live version or its owner opens it in Snowsight. CREATE STREAMLIT copies the files once, so after you change the code, PUT it
again and re-run the last two statements.
To let colleagues open it, grant a role usage on the app (the role also
needs usage on the dashboards database and apps schema):
Container or warehouse runtime: what it costs
Streamlit in Snowflake has two runtimes, and they bill in different ways. In accounts with Snowflake’s 2026_06 behavior change bundle enabled, which includes ours, a new app uses the container runtime unless you name another, so it’s worth knowing what that means.
On the default
SYSTEM_COMPUTE_POOL_CPU, a node is a CPU_X64_S, which
billed about 0.12 credits an hour in our account, and up to three apps
share one. An app opened once and then left keeps its node running for
three days: about 8.6 credits, shared with any other apps on the node.
Its queries run separately on the query warehouse.
On the warehouse runtime, an X-Small warehouse costs 1 credit an hour
while anyone has the app open, plus about 15 minutes after. A 10-minute
visit costs about 0.4 credits.
So for a dashboard one person opens a few times a week, the warehouse
runtime is cheaper. For one a team opens every day, the container runtime
is cheaper and faster, because every viewer shares one running server and
its cache. To use the warehouse runtime, leave out runtime_name and
compute_pool in an account without the bundle, or set runtime_name = 'SYSTEM$WAREHOUSE_RUNTIME'. We tested the app on the container runtime;
on the warehouse runtime, pin a recent Streamlit in an environment.yml
(1.52.2 was the newest in Snowflake’s channel in November 2026), because
format="percent" and y_label need a newer version than the oldest it
offers. Snowflake’s cost
documentation
has the details.
Things to know
- The listing’s database name is yours. Snowflake asks for a database
name when you get a listing;
SOURCEmust match it. The views are in itsEXTschema. - The app runs with its owner’s rights. Viewers see what the owner’s role can query, so they don’t need their own access to the listing.
- Annualized return over a short range is misleading. The table annualizes whatever range you pick; for under a year, read the total return instead.
- Prices are end of day. The listing updates once a day, so the dashboard isn’t a live ticker. The last date is in the table.
- Only active tickers are listed. The ticker picker filters out
inactive symbols; remove
and not is_inactiveto include them.
F.A.Q.
Do I need to install any packages?
Do I need to install any packages?
No. Streamlit, pandas and the Snowflake connector come with both runtimes, and the app uses Streamlit’s built-in
st.line_chart. You need a requirements.txt (container) or environment.yml (warehouse) only for extra libraries such as Plotly.Why does my query fail with 'Binding parameters must be a list'?
Why does my query fail with 'Binding parameters must be a list'?
st.connection("snowflake").query binds with ? placeholders and a list of values. Replace %(name)s placeholders with ? and pass params=[...] in the same order.How do I update the app after changing the code?
How do I update the app after changing the code?
Upload the file again with
PUT, then run CREATE OR REPLACE STREAMLIT and ALTER STREAMLIT ... ADD LIVE VERSION FROM LAST. In Snowsight, edit the code in the app’s editor and click Run.Which runtime is cheaper?
Which runtime is cheaper?
For occasional use, the warehouse runtime, which stops about 15 minutes after the last activity. For daily use by several people, the container runtime, which keeps one shared server running for up to 3 days after the last viewer.
Can I show intraday or real-time prices?
Can I show intraday or real-time prices?
Not from this listing, which has daily open, high, low, close, adjusted close and volume. Real-time quotes need an external feed and an external access integration.